“2026 Benchmark land prices” were announced
- Japanese real estate expertise
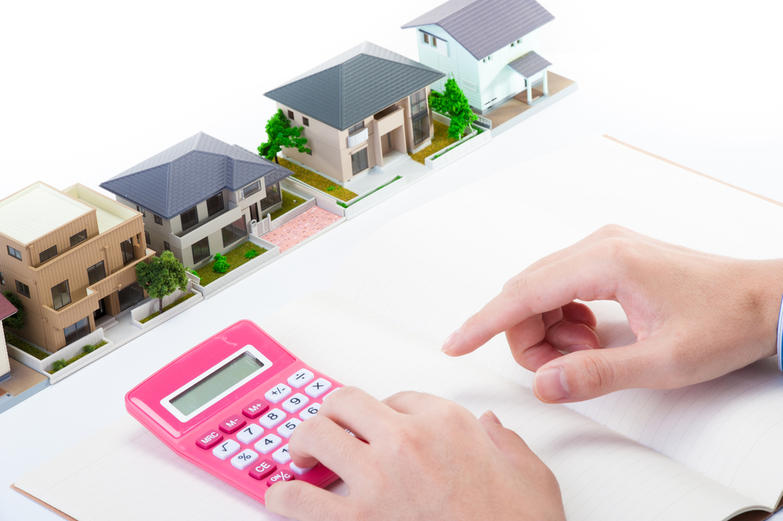
In Tokyo, land prices—particularly in central areas—continue to rise, driven by factors such as ongoing redevelopment, strong housing demand, and the growth of inbound tourism.
One indicator used to track these trends is the “Benchmark Land Price.”
Benchmark Land Prices are surveyed and published annually by prefectural governments based on land values as of July 1. They serve as a key benchmark for understanding land price trends across Japan.
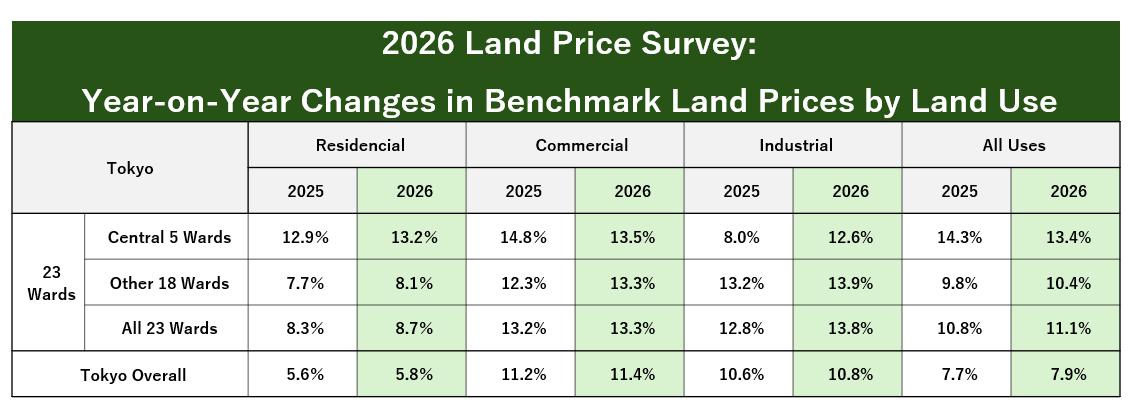
Data released in September 2026 on Tokyo’s Benchmark Land Prices showed an average increase of +5.8% for residential land and +11.4% for commercial land across the metropolis, indicating that land prices continue to trend upward.
Reference Date: July 1, 2026 / Published by the Tokyo Metropolitan Government Bureau of Finance on September 16, 2026 (Summary released on September 15, 2026)
① Residencial Area
Tokyo-wide
Average Year-on-Year Change: +5.8% (Previous Year: +5.6%)
Highest Land Price: ¥7.5 million/m² in Akasaka 1-chome, Minato-ku
Largest Increase: +18.8% in Kita-Shinagawa 5-chome, Shinagawa-ku
Key Factors Driving the Rise in Land Prices:
・Strong housing demand across Tokyo
・Concentrated demand for highly accessible locations, particularly areas near stations and redevelopment zones
・Limited availability of land for condominium development and strong acquisition demand
Tokyo’s 23 Wards
Average Year-on-Year Change: +8.7% (Previous Year: +8.3%)
All 23 wards recorded positive average year-on-year changes.
The average increase was +13.2% in the five central wards and +8.1% in the remaining 18 wards.
Minato-ku accounted for six of the top 10 locations with the highest rates of increase, while the remaining locations were in Shinagawa-ku, Taito-ku, Koto-ku, and Toshima-ku.
Land prices continue to rise, particularly in central Tokyo, with strong increases also seen in areas undergoing redevelopment and locations with excellent transportation access.
② Commercial Area
Tokyo-wide
Average Year-on-Year Change: +11.4% (Previous Year: +11.2%)
This increase significantly exceeds the +5.8% recorded for residential land.
Highest Land Price: ¥52.5 million/m² in Ginza 2-chome, Chuo-ku
Largest Increase: +26.9% in Asakusa 1-chome, Taito-ku
Key Factors Driving the Rise in Land Prices:
・Growing demand for hotels and retail space driven by the increase in inbound tourism
・Progress in redevelopment projects in central Tokyo and around major stations
・Strong demand for office space, particularly in central areas
Land prices remain high in prime commercial districts in central Tokyo, such as Ginza. Meanwhile, strong land price increases are also being seen in commercial areas that attract large numbers of tourists, such as Asakusa.
Tokyo's 23 Wards
Average rate of change: +13.3% (previous year: +13.2%)
All 23 wards recorded a positive average rate of change.
The rate was +13.5% for the five central wards and +13.3% for the remaining 18 wards.
Taito-ku accounted for six of the top ten locations with the highest rates of increase for commercial land; particularly high growth was observed in areas with strong tourism demand, such as Asakusa.
③ All Uses
For the year-on-year change across all land uses by ward, Taito-ku recorded the highest increase at +19.2%, followed by Bunkyo-ku (+15.5%), Arakawa-ku (+15.0%), and Minato-ku and Shinjuku-ku (both +14.5%).
Key Features of the 2026 Benchmark Land Prices
In 2026, Tokyo’s Benchmark Land Prices rose for the 14th consecutive year for residential land and the fifth consecutive year for commercial land.
These results indicate that rising land prices are not limited to select areas of central Tokyo. Rather, the upward trend is spreading across a broader range of areas, supported by factors such as redevelopment, excellent transportation access, strong demand for housing and office space, and the growth of inbound tourism.
When analyzing the real estate market, it is important to look beyond the overall rate of price appreciation and consider location-specific trends—particularly which areas are experiencing price increases and the factors driving those increases.
Source: Tokyo Metropolitan Government Bureau of Finance, 2026 Tokyo Metropolitan Benchmark Land Prices
 Availability
  Enquiry